Category: Guide 2

  • Risk 17 Perception of poor climate change outcomes for Spartina

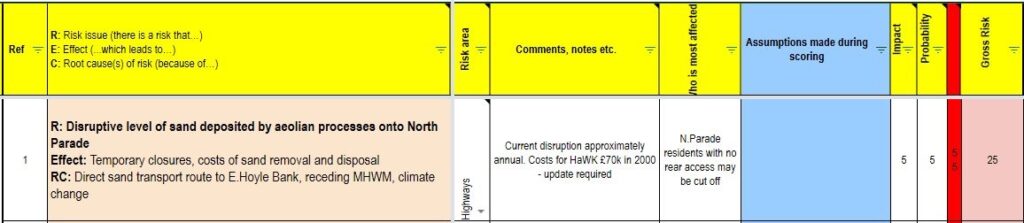
    Risk 17: Preliminary risk assessment around climate impact of allowing the green beach to develop or returning to raking.

    Headline: There are strongly positive climate change benefits if saltmarsh develops, and we can anticipate approximately half the benefits if dunes develop and negligibly small negatives if raking resumes.

    This assessment looks into concerns that despite indications to the contrary, Spartina-rich saltmarsh, as opposed to dunes, will form and further concerns that Spartina may have a negative effect on climate change. 

    Methane is released when plants decay and are digested underground in conditions of very low oxygen, by anaerobic bacteria. (Wang et al 2017) Fortunately, these bacteria are inhibited, or more accurately outcompeted by sulphate-reducing bacteria in brackish conditions such as saltmarshes. Recently an alternative route for methane production has been identified in green plants. There is still some uncertainty about the biochemical pathway involved, but there is evidence that methane is released in response to stress, like trampling or cutting. (Wang 2009).

    Studies in China and Australia have identified increases in methane production following the colonisation of bare mudflats by Spartina, with an increase in aerobic methane production by around an order of magnitude (10x as much) (Yuan et al 2019, Gao et al 2018) This finding has caused alarm amongst some people, yet saltmarsh is still advocated by climate change scientists as an important tool in the fight to achieve climate change targets (Rosentreter et al 2021 Bertonlini & Mosto 2021) Even in Australia, where Spartina is classed as a damaging invasive species, the decision to remove is not simple (Kennedy et al. 2018) This despite Methane having around 80x the effect of Carbon Dioxide in terms of the greenhouse effect. The primary purpose of this post is to explain why this is.

    .

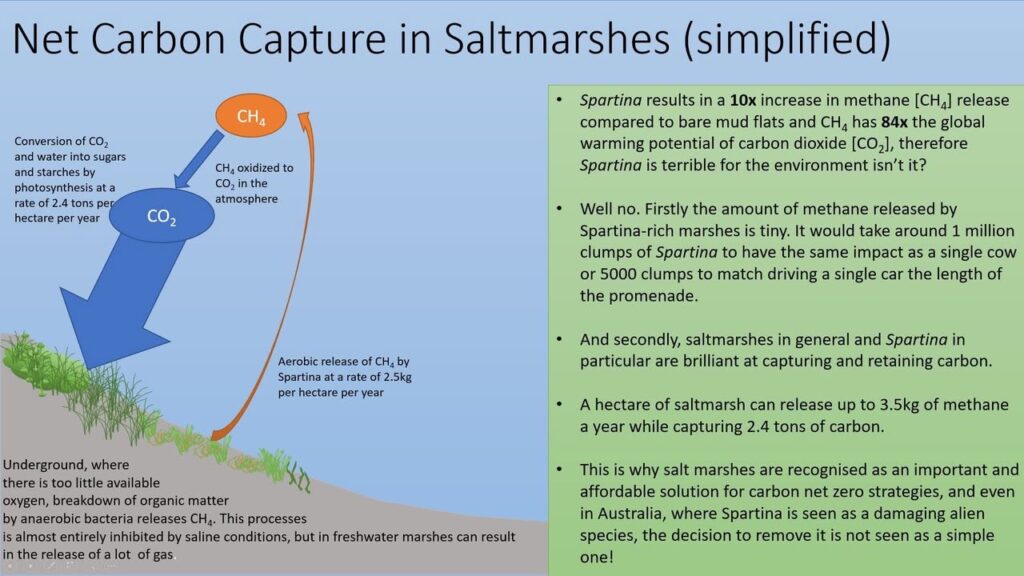
    Why do climate change scientists advocate the use of saltmarsh to combat climate change despite methane production?

    The two figures show a simplified and a more detailed illustration of the pathways involving methane and carbon dioxide around saltmarshes. The main thing to notice is that the amount methane production is tiny, whilst the amount carbon sequestration is huge. The measurements quoted in (Yuan et al 2019) are 6 μmol per kg ofSpartina whilst the figured for carbon capture eg from (Beaumont et al 2013) is measured as 2-3 tons per hectare per year. (Burden et al 2019) There are different volumes and timescales here, so a little work is needed to compare them directly, but the fact that one is quoted in μmols, which are a count of the number of molecules, and the other is measured in tons, is a good indication.

    This is working out if anyone wants to check it.

    • 6μmol per kg of grass per day is 2190μmol a year 
    • The average weight of Spartina per square meter is 750g so we can say 1642 μmol per square meter per year. Knowing the density of methane, it’s then possible to work out both the weight ( 0.0351 grams) of methane and its volume 0.05 litres per year (figure 3). As aside a cow produces up to 500 a day. A typical Spartina clump is about 1 square meter in size.
    • A hectare is 10,000 square meters:
    • Thus a hectare of continuous spartina saltmarsh could produce 3.51Kg of Methane a year while it captures 2.42 tons of carbon dioxide. Methane is oxidised to Carbon Dioxide in the atmosphere and has on average less than 10x the life span (IPCC 2021.) This is why saltmarshes are seen as so important in the battle against climate change.

    Dunes and raking

    The carbon sequestration and storage capacity of dunes is approximately half that of salt marshes (Beamont 2013, Drius 2017)

    There may be some release of already captured carbon as Methane if raking resumes, the volume of which will depend on how the organic material above and especially below the surface is treated after it is destroyed. Aerobic/anaerobic conditions and salinity being the most important factors. This could be mitigated if the decision to dig up the green beach is taken.

    .

    REFERENCES

    Beaumont et al 2013 The value of carbon sequestration and storage in coastal habitats 

    Bertonlini & Mosto 2021 Restoring for the climate: a review of coastal wetland restoration research in the last 30 years 

    Burden et al 2019 Effect of restoration on saltmarsh carbon accumulation in Eastern England 

    Drius et al 2016 The role of Italian coastal dunes as carbon sinks and diversity sources. A multi-service perspective 

    Gao et al 2018 Exotic Spartina alterniflora invasion increases CH4 while reduces CO2 emissions from mangrove wetland soils in southeastern China 

    Hussey et al 1982 Seasonal Changes in Weight of Above- and Below-Ground Vegetation and Dead Plant Material in a Salt Marsh at Colne Point, Esse

    IPCC 2021 

    Kennedy et al. 2018 Invasive cordgrass (Spartina spp.) in south-eastern Australia induces island formation, salt marsh development, and carbon storage 

    Yuan et al 2019 Spartina alterniflora invasion drastically increases methane production potential by shifting methanogenesis from hydrogenotrophic to methylotrophic pathway in a coastal marsh 

    Rosentreter et al 2021, Half of global methane emissions come from highly variable aquatic ecosystem sources  

    Kroeger et al 2017 Restoring tides to reduce methane emissions in impounded wetlands: A new and potent Blue Carbon climate change intervention. 

    Wang et al 2009 Physical injury stimulates aerobic methane emissions from terrestrial plants 

    Wang et al 2017 Identifying the salinity thresholds that impact greenhouse gas production in subtropical tidal freshwater marsh soils 

  • Risk 1 – Sand Inundation incidents in Liverpool Bay

    Offshore sandbanks are never static, their substrate is moved around by tides, and when they are exposed and have time to dry out, by the wind too. Sometimes these forces align to produce very rapid (in geological terms, though sometimes also in human terms) movements. These can be enough to smother coastal towns completely.

    Nearby examples of towns damaged or destroyed by moving sand banks:

    Meols: In the late 15th Century, Meols was continuously inhabited from prehistoric times until the close of the 15th Century. Whilst there are no contemporary descriptions of events that led to the abandonment, there is a thick layer of wind-blown sand that covered habitations and agricultural lands alike. The seat of the de Melas family was relocated to Wallasey due to degradation of the fields and loss of the Manor House. It is believed that an extreme weather event caused an offshore sandbank to move inland with such suddenness that there was little time to retrieve possessions. Consequently, Meols is renowned as one of the richest medieval archeological sites in the country (1,2) Wirral’s own sandy Pompeii!

    There are other less well-described incidents in the medieval period, including Birkdale, Ainsdale, Formby, Crosby, and Hightown (2) 

    Formby: In 1739, Formby suffered a second catastrophic sand inundation which was described in contemporary literature: 

    “In 1690 there was a deep-water channel close to the shore at Formby, with a sandbank outside it which gradually came nearer and nearer. At length, it joined the coast, from which sand commenced to blow, so that in a short time the cultivated ground, gardens, orchards and streets of Formby were entirely covered up.” (3) 

    This necessitated the brick by brick removal, relocation and reconsecration of the Church. Formby was saved from further inundation by the labours of Mr Freshfield who created and planted sandbanks as a barrier to further wind-blown sand, and eventually, the ground lost to sand was reclaimed.

    St Annes 1918-1938: The North Channel of Ribble ran around 200m from the promenade at St Anne. In the late 1800s, the channel started to fill with silt following reduced water flows. By 1910, the channel was no longer navigable and by 1918 it was just a muddy gutter. This gutter filled with wind-blown sand from the Horse Bank, which formed an unbroken sand transport pathway directly to the promenade. By 1930 the beach level at St Annes had risen by 7m. Sand regularly blew over the road, cutting off access and the promenade was unusable. The town council tried to hold back the sand with a sand shield, but this failed after a few years. Costs of clearing up mounted and eventually a decision was made to learn from the fate of Formby. Starr Grass was profusely planted to stabilise the sand collecting against the promenade wall into fixed dunes 4,5

    The situation at Hoylake in 2021 is more or less identical to those at Formby in 1720 and At Annes in 1920. We have lost a channel (the Hoyle Lake,) even its silt is now covered in sand and a large sandbank (the East Hoyle) is moving ashore.

    #risks

    References

    1 Brown, P. J. (2015). Adverse weather conditions in medieval Britain: An archaeological assessment of the 

    impact of meteorological hazards, Masters Thesis, University of Durham  (LINK BROKEN)

    2.Griffiths, D., Philpott, R.A., Egan, G (2007) Meols: The archaeology of the North Wirral coast. Oxford 

    University School of Archaeology: Monograph 68, Institute of Archaeology, University of Oxford 

    3. De Rance, C. E. (1877). The superficial geology of the country adjoining the coasts of southwest 

    Lancashire, comprised in sheet 90, quarter-sheet 91SW, parts of 89NW and SW, 79NE and 91SE of the 1-inch geological survey of England and Wales.Memoirs of the Geological Survey of England and Wales. Longmans, London 

    4. Too much sand 

    5. Where does all this sand come from 

  • Introduction and documents

    Risk Management Plan for Hoylake beach

    A preliminary risk investigation is shown here

    A follow-up document is in preparation which is a risk assessment for returning to the raking previous management regime (without spraying) and doing nothing – i.e. allow the succession processes to continue unhindered and unaided.  It can be found here.

    This document will evolve as the discussion progresses and new information is released.

    The risks currently identified are as follows. There will be posts and discussions on each of these

    Raking specific

    • Council prosecuted for damaging the SSSI/Ramsar site
    • Raking spreads Spartina and removes its competitors

    More significant for raking

    • Disruptive level of sand deposited by aeolian processes onto North Parade 
    • Storm surge, combined with a spring tides causes a high volume overtopping of the promenade
    • Sand acts as a resevoir for enterococci

    Green Beach Specific

    • Some visitors deterred by the lack of groomed beach, presence of vegetation
    • excessive dune build-up causes complaints from residents
    • excessive dune build-up prevents the launch of the lifeboat

    More significant for Green Beach

    • Worries about mosquitos
    • Worries about rats

    The Current Matrix for scoring these risks is shown in the figure. This may change with discussion.

  • Risk 1. Disruptive level of sand deposited by aeolian processes onto North Parade

    Current risk score Raking 25/25, no raking 10/25

    Wind-driven (Aeolian) transport of sand occurs by 3 principal mechanisms: 

    • Suspension in the wind, which accounts for 1% of transportation
    • Saltation, a hopping motion, which accounts for 95% of sand transport
    • Reptation or creep which accounts for approximately 4% of sand transport

    Saltation is the dominant process in locations such as Hoylake. It can start with wind speeds as low as 9mph when sand is dry, and silt-free. Moisture, salt, silt and organic matter increase sand cohesion and so reduce saltation. In contrast, raking reduces sand cohesion and increases saltation. Saltating sand particles “splash” when they impact with the beach. This results in an increase in the number of sand particles that are mobile, with each hop.

    As an illustration, with wind at 20m/s (44mph) that steady state is 6.75m3 of sand per meter per day. If all this sand reached the promenade, the road would be impassable in a few hours (Bagnold, 1941). Whilst force 9 gales are not common, we can expect conditions like this to occur approximately annually.

    Sand will continue to saltate until either:

    • The wind drops or the particles are in the lee of an object
    • The saltating sand meets an area with greater cohesion – eg. moisture or silt
    • The sand meets an obstruction or a gradient which is too steep for the wind strength

    The sand is now dangerously close to overtopping the wall, and when it does the increase in sand problems will be dramatic.

    #risks

    References

    Bagnold, R. A. (1941). The physics of blown sand and desert dunes. Methuen, New York.